- A recent study found that, for each dollar invested in mitigation, a benefit of more than 4 dollar can be generated. (MMC, 2006)
- The Boston Harbor Association has created three flooding scenarios based on the City of Boston Assessing Department database of property parcel data within the city. Illustrations of the total footprint of properties that are vulnerable to coastal flooding is mapped out if no effective strategies are applied to stop the rising sea level. (The Boston Harbor Association 2012)
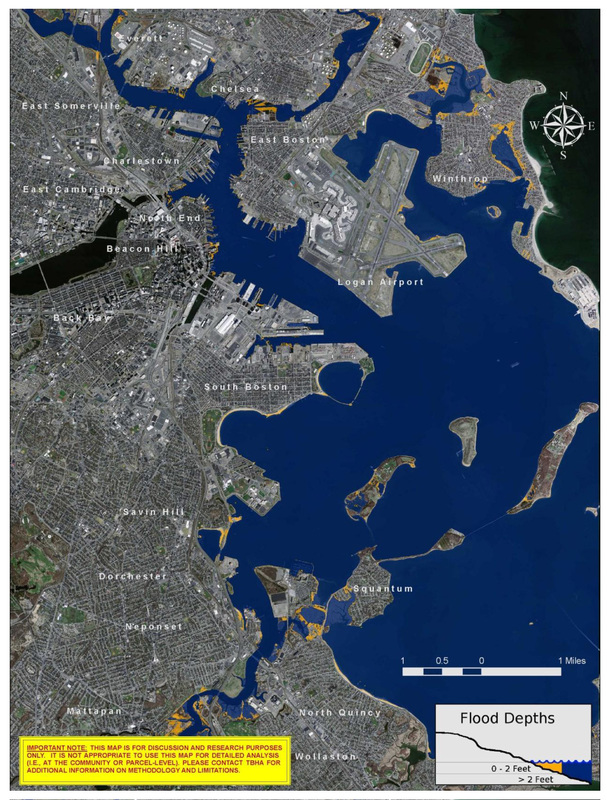
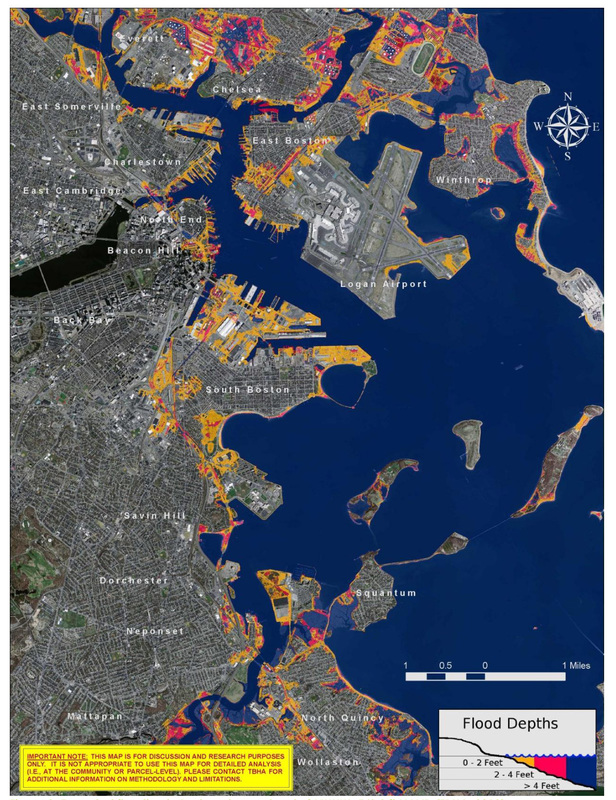
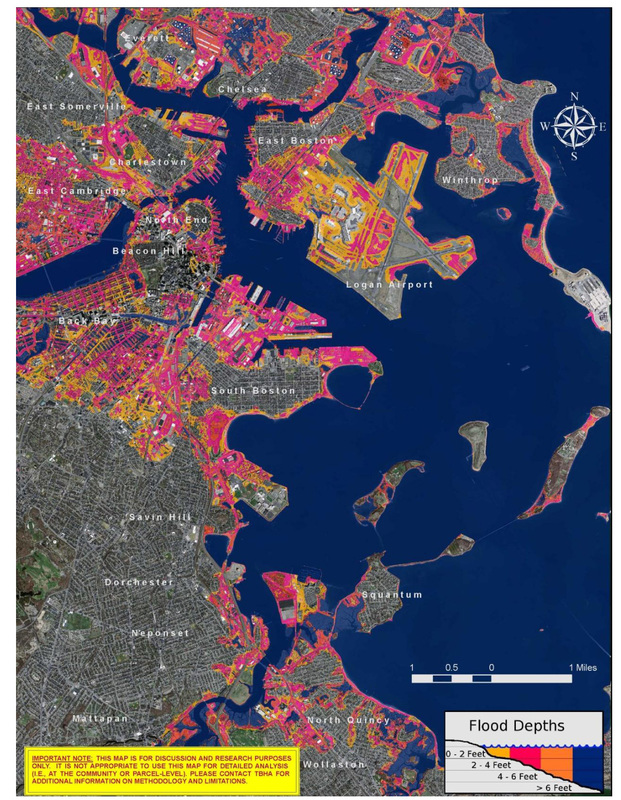
Figure 16. Scenario 1: Mean Higher High Water + 2.5 ft
Figure 17. Scenario 2: Mean Higher High Water + 5 ft
Figure 18. Scenario 3: Mean Higher High Water + 7.5 ft
Figure 17. Scenario 2: Mean Higher High Water + 5 ft
Figure 18. Scenario 3: Mean Higher High Water + 7.5 ft
- The Boston Harbor Association has also estimated the impacts of Scenario 2 and 3 on neighbourhood and historic districts.
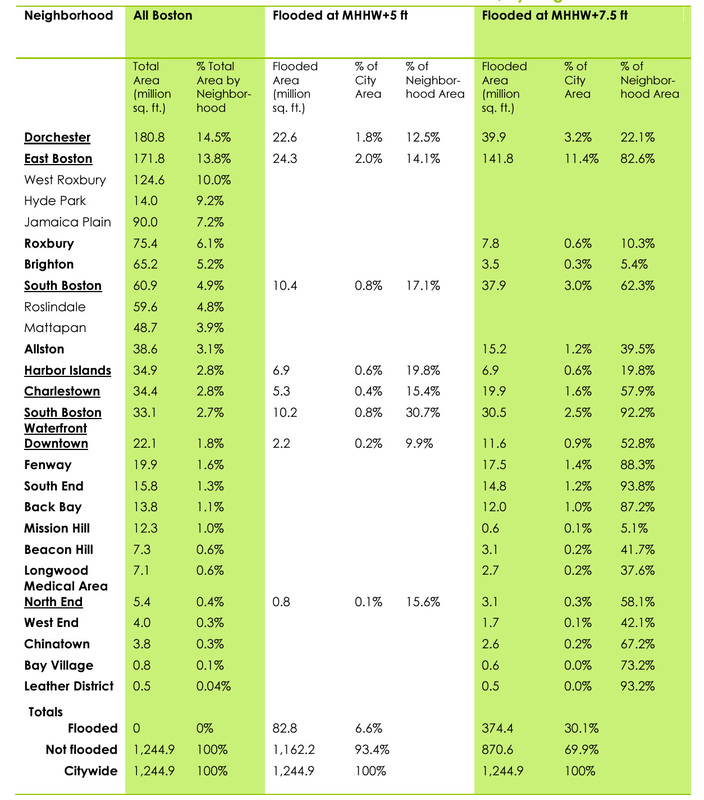
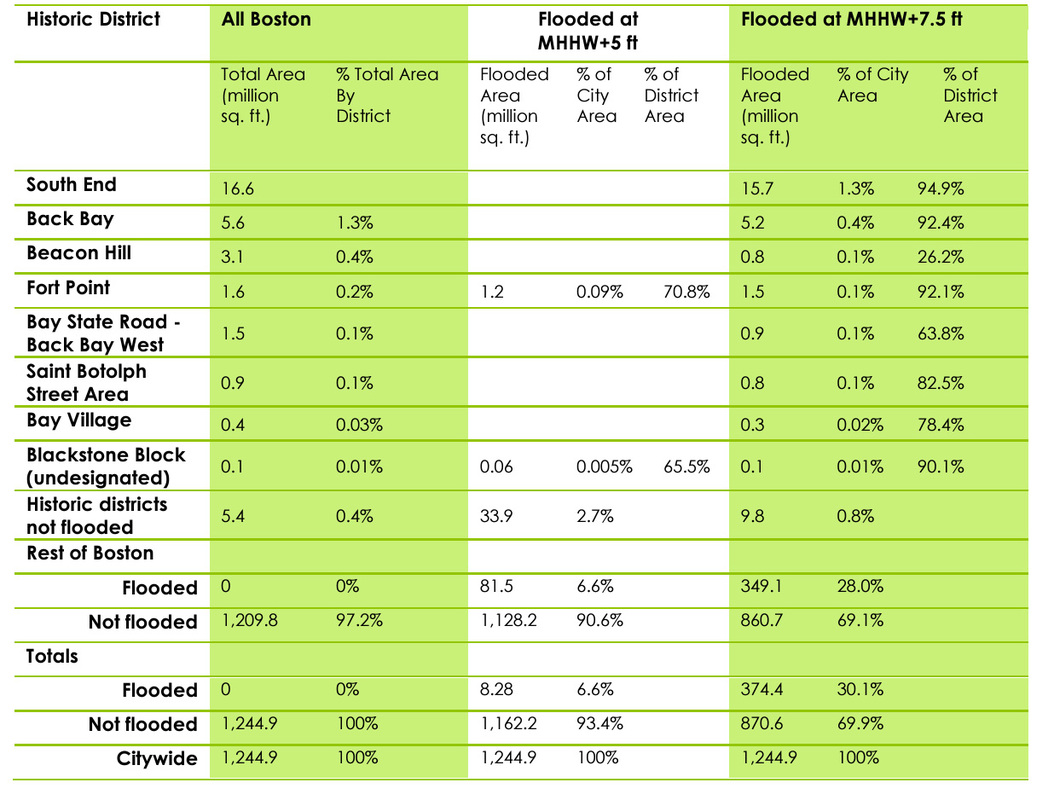
Figure 19. Area of Boston flooded at MHHW+5ft and MHHW+7.5ft by neighbourhood
Figure 20. Area of Boston flooded at MHHW+5ft and MHHW+7.5ft by historic district
Figure 20. Area of Boston flooded at MHHW+5ft and MHHW+7.5ft by historic district
Reference
Kirshen, Paul, 2012, 2012 11 Sea Level Rise – Boston’s Waterfront After Hurricane Sandy, the Botston Harbor Association, vedio recording, YouTube, Viewed 28 August 2015
https://www.youtube.com/watch?v=w2DSaJV--mc
Multi-hazard Mitigation Council (MMC) (2006). Natural Hazard Mitigation Saves: An Independent Study to Assess the Future Savings from Mitigation Activities. National Institute of Building Sciences, Washington, DC.
https://www.youtube.com/watch?v=w2DSaJV--mc
Multi-hazard Mitigation Council (MMC) (2006). Natural Hazard Mitigation Saves: An Independent Study to Assess the Future Savings from Mitigation Activities. National Institute of Building Sciences, Washington, DC.
