For mitigation strategies in terms of reducing greenhouse gas emission, it contains three main sections:
Bai, Lu, 2015, Categories & Share of 2020 Goals, Piktochart
<https://magic.piktochart.com/output/7858255-untitled-report>
<https://magic.piktochart.com/output/7858255-untitled-report>
Then each section is break down into detailed and specific strategies with their status (existing, expanded, proposed), jurisdiction (Federal, Massachusetts, Boston), share of 2020 goal and supplementing descriptions.
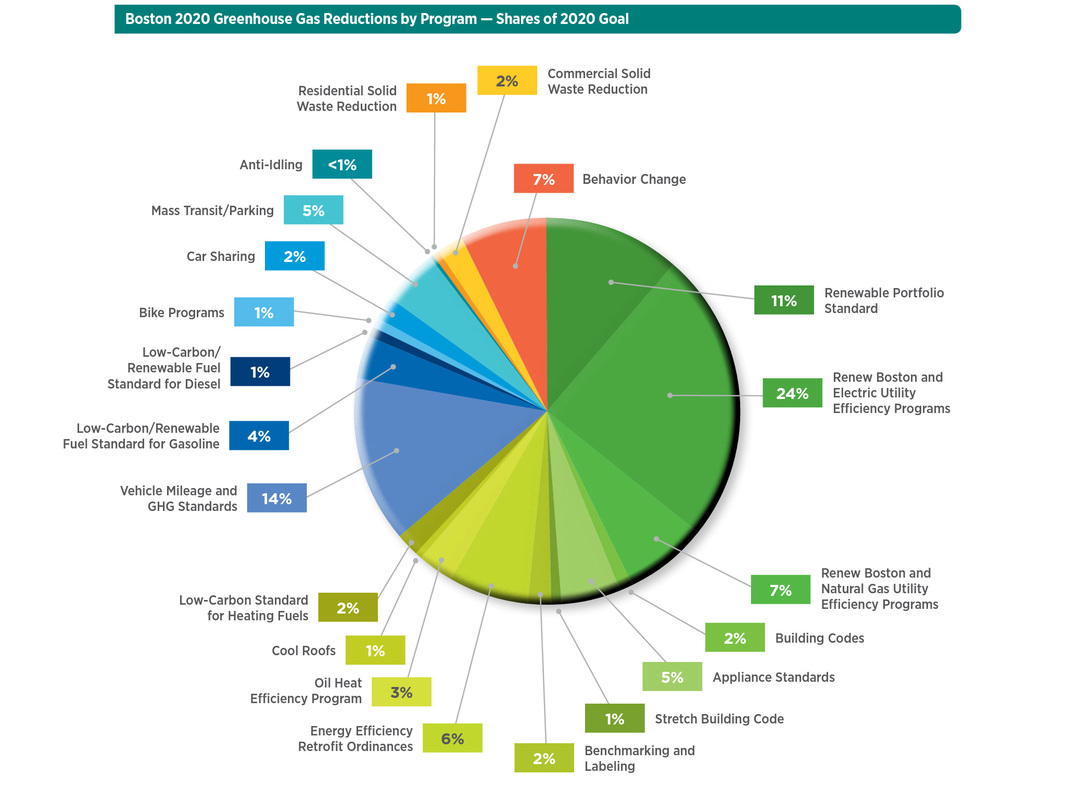
Figure 3. Boston 2020 Greenhouse Gas Reduction by Program – Shares of 2020 Goal (Boston Climate Action Plan 2011 p.16)
The following chapters will briefly introduce strategies for each sections.
- Buildings and Energy Sources
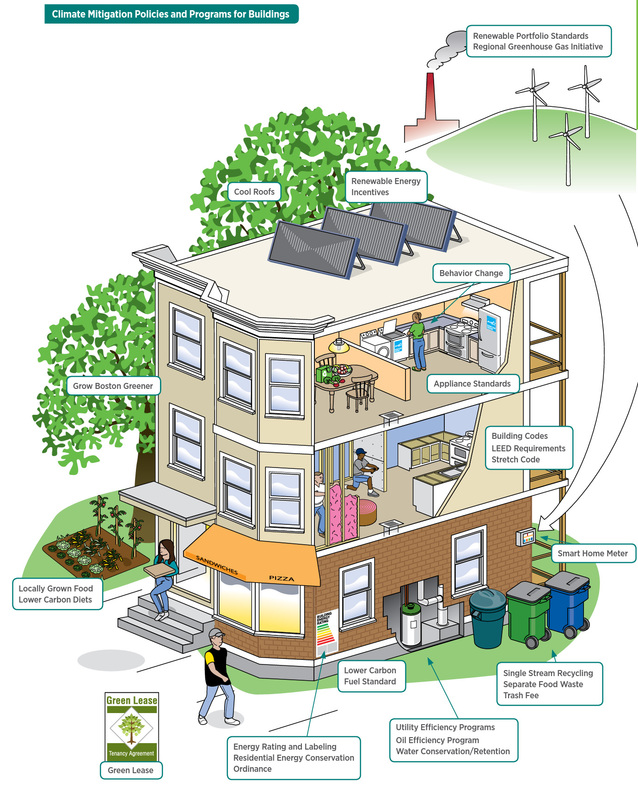
Figure 4. Climate Mitigation Policies and Programs for Buildings (Boston Climate Action Plan 2011 p.19)
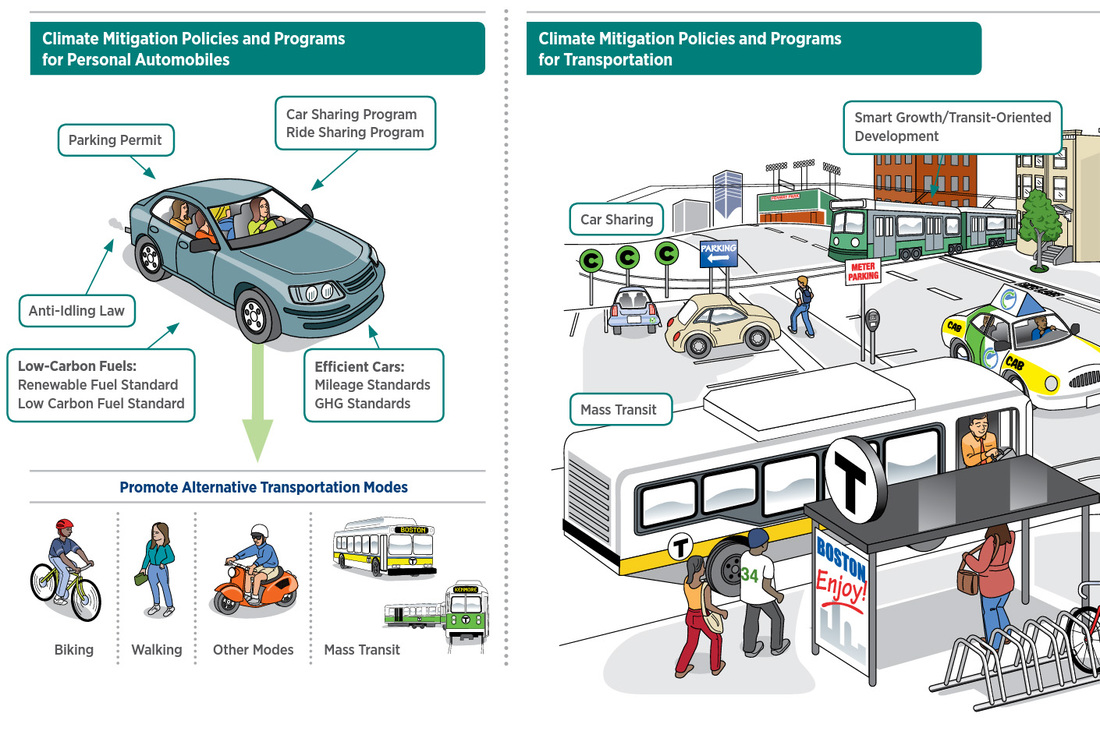
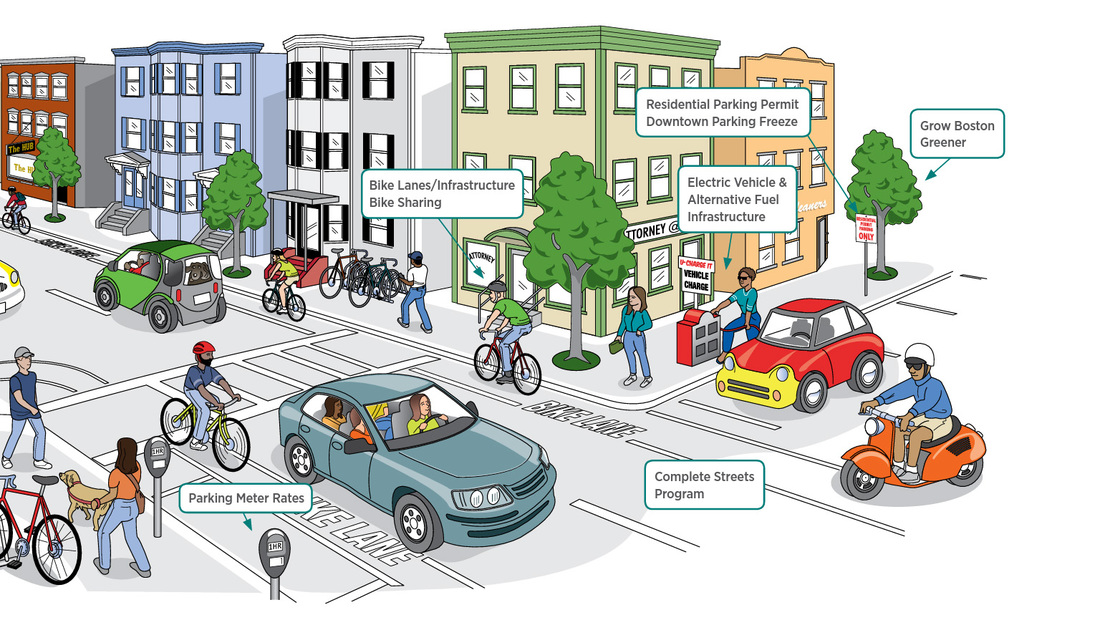
- Transportation
|
|
Figure 5&6. Climate Mitigation Policies and Programs for transportation (Boston Climate Action Plan 2011 pp.26-27)
- Solid Waste
The strategies mainly includes provides motivation, equipment and information to all residents; establish a mandatory policy for waste recycling; organic waste comprehensive program development; innovative advocate polices for plastic bags, bottle deposits and applying economic incentive for recycling. (Boston Action 2011 p.34)
Overall Mitigation Results
Estimation of the economic benefits of climate mitigation is a total net saving of $2 billion in energy coast by 2020 (Boston Climate 2011 p.16). Furthermore, successful mitigation will also improve public health as there would be less air pollution, traffic congestion.
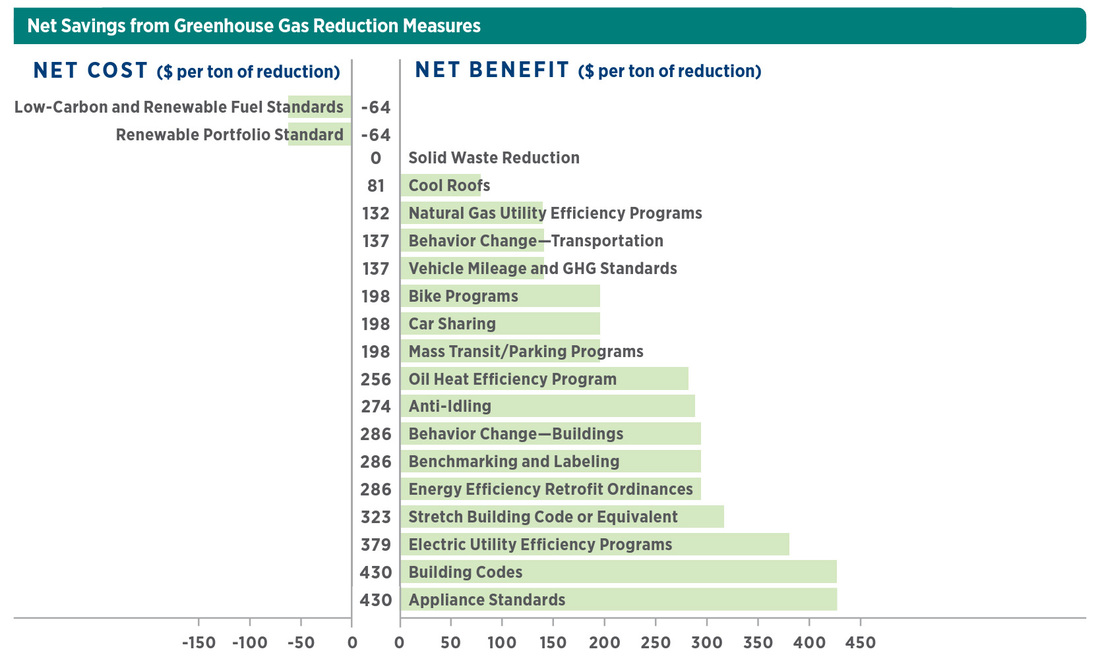
Figure 8. Net Savings from Greenhouse Gas Reduction Measures (Boston Climate Action Plan 2011 p.17)
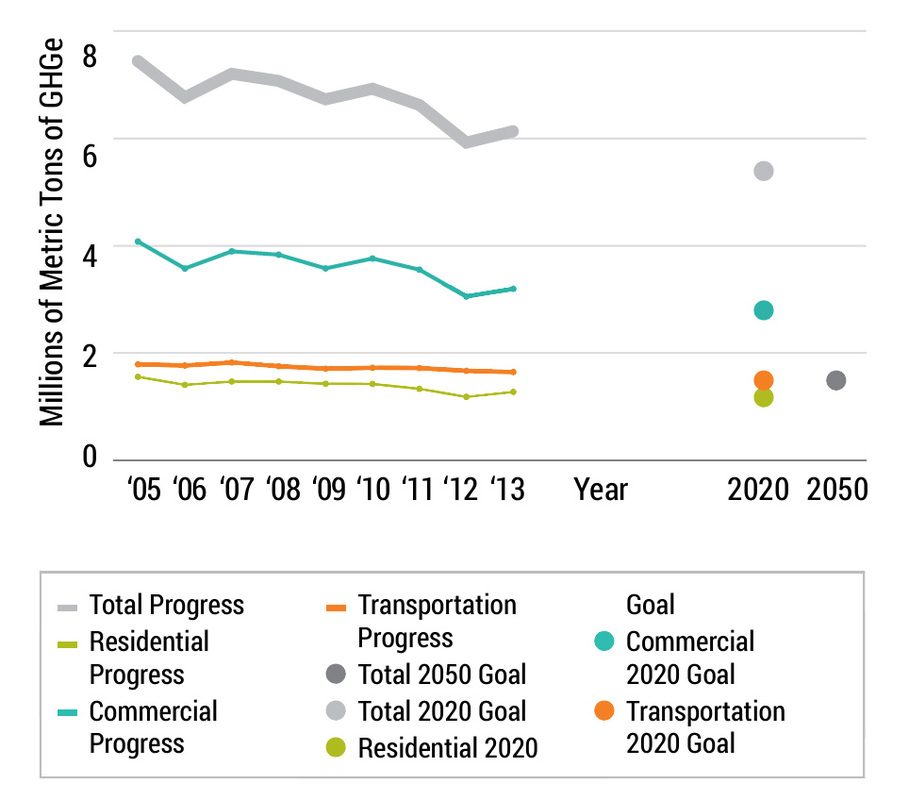
Reduction from building and energy sources is identified as the largest sector for 2011 action plan. To assess whether it is effective or not, we can take a look into the beginning chapters of the Greenovate Boston 2014 Climate Action Plan Update. It illustrates the overall decreasing trend of Greenhouse Gas emission from 2005 – 2013. It is a powerful evidence to see a gradual decrease in all progress sectors. Boston has achieved approximately 17% reduction. The most outstanding one is the commercial progress and the most of these reduction is because of cleaner energy.
|
|
Figure 9&10. GHG Progress and Goals by sector, 2005-2013 (Greenovate Boston 2014 pp.6-8)
Analysis of best practice and result from
Climate Mitigation Action for Building and Energy Sources
1. One of the leading organisation for building energy efficiency and renewable energy is Renew Boston. Cost for Boston’s electric and natural gas utilities is expected to be more than $60 million per year.
2. In order to maximise community engagement, Renew Boston has built up connections with various community advocate campaign and public management structure.
Fuel oil is used to generate heat for nearly 25% of Boston household. Cleaner energy sources like natural gas would generate less greenhouse gas emission compare to fuel oil. Therefore, a state-wide surcharge on oil consumers and oil-related energy efficiency programs are proposed by Boston City Government. |
By 2020, adoption of new building code will help Boston achieve 1% reduction in carbon emission.
|
Result
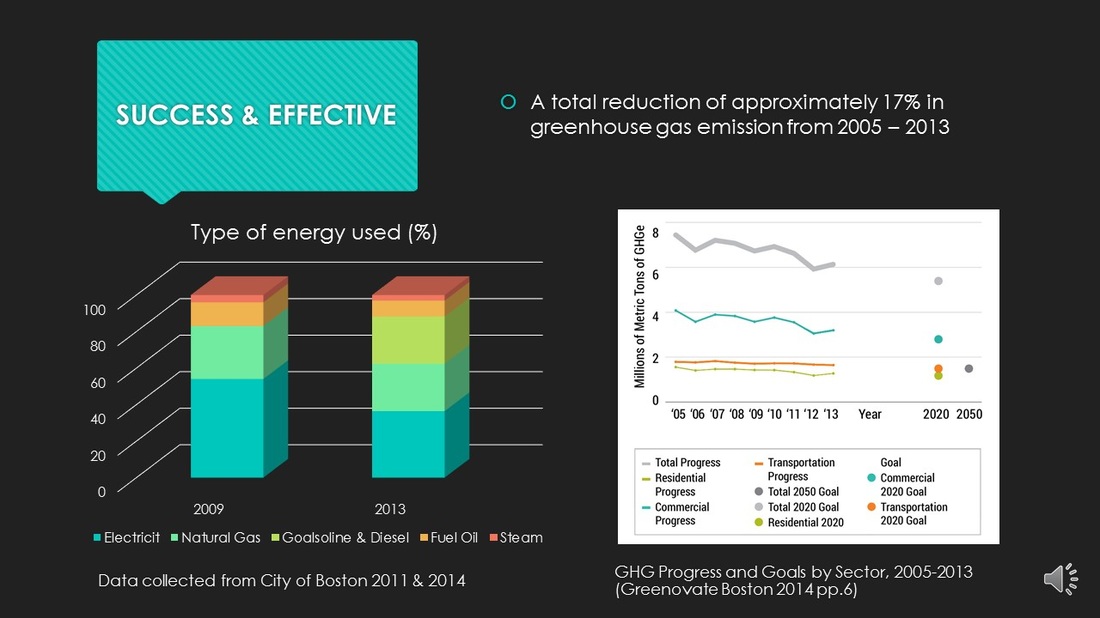
Figure 11. GHG Reduction by Source
Data of 2009 is collected from Boston Climate Action Plan 2011 p.18
Data from 2013 is collected from Greenovate Boston 2014 p.19
Data of 2009 is collected from Boston Climate Action Plan 2011 p.18
Data from 2013 is collected from Greenovate Boston 2014 p.19
- The shift away from oil-related energy consumption has a significant contribution in reducing greenhouse gas emission.
- Development of renewable energy will reduce Boston’s emission for about 3%
- By 2020, adoption of new building code will help Boston achieve 1% reduction in carbon emission.
Barriers
Effective implementation of government’s policy is highly dependent on the voluntary participation of residents, business and community. The city government have to maximize engagement from all level of society.
Reference
City of Boston, 2011, A Climate of Progress City of Boston Climate Action Plan Update 2011, City of Boston, Viewed 10 August 2015
http://www.cityofboston.gov/images_documents/A%20Climate%20of%20Progress%20-%20CAP%20 Update%202011_tcm3-25020.pdf
City of Boston, 2014, Greenovate Boston 2014 Climate Action Plan Update, City of Boston, Viewed 10 August 2015
http://www.cityofboston.gov/eeos/pdfs/Greenovate%20Boston%202014%20CAP%20Update_Full.pdf
